mail_outline sales@mediastorehouse.com
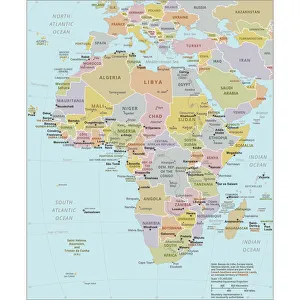
Political Map of AfricaVector Illustration of the policital map of Africa Reference map as created by the US Central Intelligence Agency
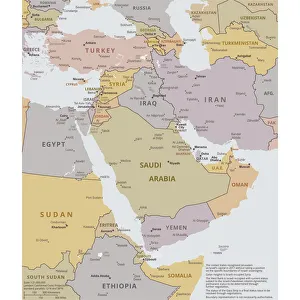
Political map of The Middle EastVector illustration of the policital map of The Middle East Reference map was created by the US Central Intelligence Agency
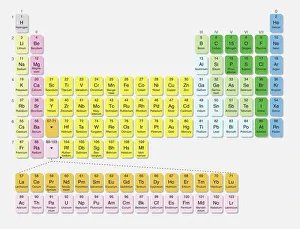
The Periodic Table Digital IllustrationIn the late 19th century, Russian chemist Dmitri Mendeleev published his first attempt at grouping chemical elements according to their atomic weights
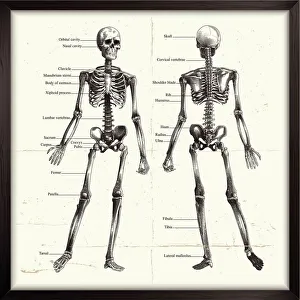
Labelled Human Skeleton. EngravingLabelled engraved image of human skeleton
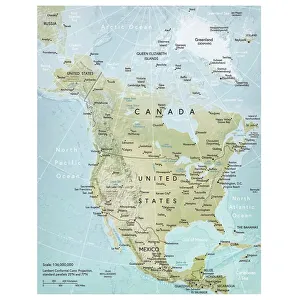
North America mapVector illustration of a detailed map of North America. Reference map was created by the US Central Intelligence Agency and is available as a public domain map at the University of Texas Libraries
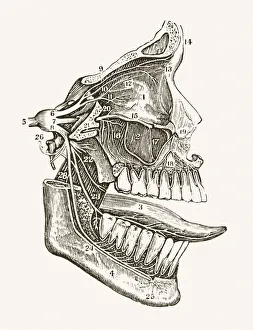
Facial Nerves 19 century medical illustrationPhotograph of the original illustration from A System of Human Anatomy by Erasmus Wilson published in 1859
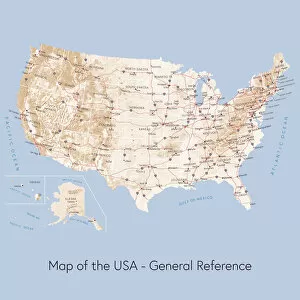
Map of the USA general referenceVector illustration of a map of the United States of America. The reference map used in the creation of this illustration is public domain map available at the University of Texas website: http
Pie chart illustration showing land use the United Kingdom
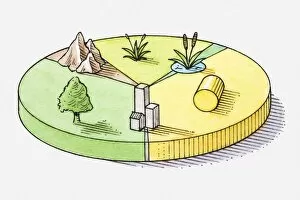
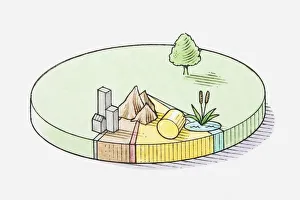
Pie chart illustration of grassland, wetland, farmland, forest, mountain and built-up areas of Spain
Cross section biomedical illustration of plasma pie chart showing 90% water and 10% dissolved substances
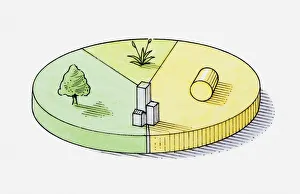
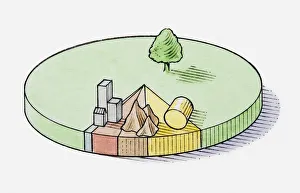
Pie chart illustration representing grassland, forest, farmland and built-up areas of Portugal
Pie chart iIllustration of percentage of population in urban and rural areas, example of Portugal with a majority of rural population
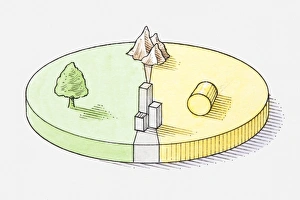
Pie chart illustration representing farmland, forest, mountain, and built-up areas of Germany
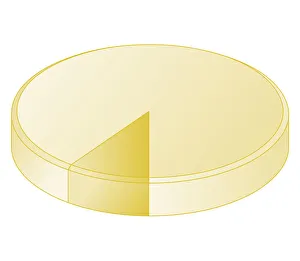
Illustration of white and yellow figures on pie chart
Illustration of pie chart showing percentage of land use in Finland
Illustration of pie chart showing distribution of land use in Sweden
Illustration of pie chart diagram showing percentage of people living in urban and rural areas in Spain
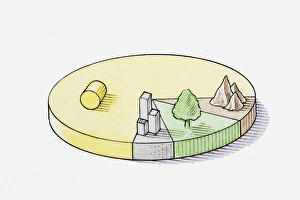
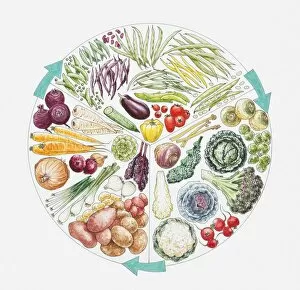
Illustration of root, brassica, and legume vegetables arranged in pie chart with direction arrow signs
Illustration of Hydrogen symbol
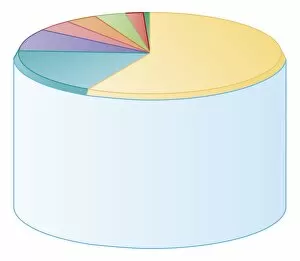
Illustration of multi-coloured pie chart
Illustration of pie chart
Symbolic image depicting knowledge, blue head with various written tables mathematical formulas, chemical formulas, excerpts from Platos Allegory of the Cave etc